
Article contributed by Agnes Yohannan, Clinical Audiologist, MSc Audiology
You may have come across the term “Audiogram” when taking a hearing test. Basically, an audiogram is the findings of your hearing test.
Hearing tests are carried out by a hearing healthcare professional—usually an audiologist—to understand the functionality of your hearing system.
Pure Tone Audiometry (PTA) is the main hearing test for understanding your hearing ability.
What Happens During a Pure Tone Audiometry Test?
During pure tone testing, you will be asked to respond to sounds/tones that will be played through a sound-generating device (headphones). The loudness level and frequency of the tones played will be controlled by the Audiologist. Each time you hear a sound you will signal to the audiologist, usually by raising your hand or pressing a button. The minimum level at which you respond to these tones will be noted down as your sensitivity toward sounds and will be used to gain an understanding of your hearing levels.
What Is an Audiogram?
Through the testing, the audiologist will get to know how you are responding for each frequency, and the results are documented in a graph called an audiogram.
So, an Audiogram is a graphical representation of your hearing ability across different hearing frequencies. It shows the slightest level at which you can hear/detect the sounds.
Why Is Having a Hearing Test Important?
The human auditory (hearing) system is sensitive from 20Hz-20kHz, but the most important frequencies, which are essential for communication, lie between 250Hz-8kHz. So, knowing the capability of our hearing system in those frequencies will help the hearing professional to quantify your hearing capacity. Therefore, the audiogram is fundamentally used as a tool to identify and characterize your hearing ability and determine whether you could benefit from a hearing aid or implant.
How to Read an Audiogram Result?
If you look at the results, it looks like a graph consisting of an x and y axis representing different hearing parameters.
In a standard audiogram, the horizontal x-axis represents the frequency (pitch) of the sounds. This is measured in Hertz (Hz).
The vertical y-axis shows the intensity (loudness) of a sound. This is measured in dB HL (decibels Hearing Level).
The hearing health care professional will carefully understand the minimum intensity levels at which you respond to each of the hearing frequencies and will record your results in that graph as different symbols.
What Do the Symbols on an Audiogram Mean?

The red colour represents your right ear, and the blue represents the left.
The symbol “O” shows your minimum hearing level for the right ear, and “X” represents the responses of the left ear.
Note: Your audiologist may also use other symbols on your audiogram for various other testing methods and techniques.
What Is Normal Hearing on an Audiogram?
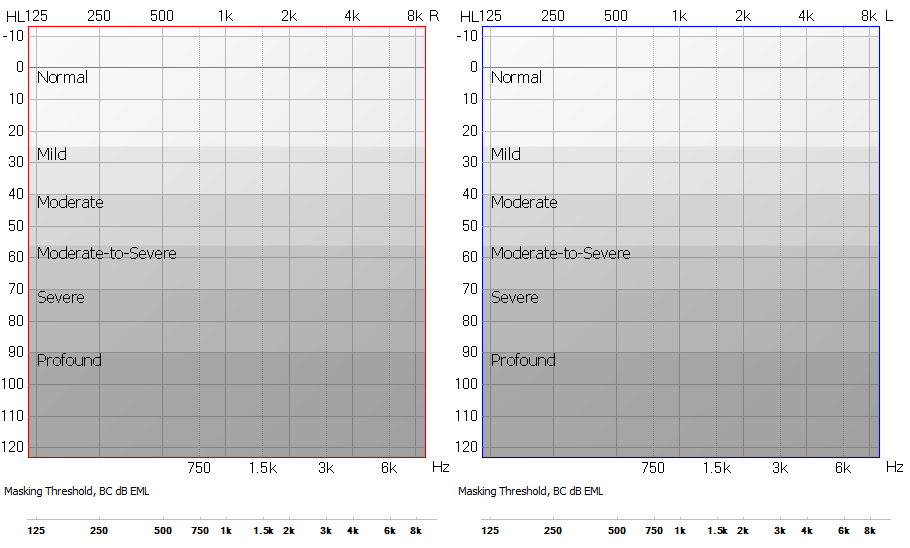
As you can see from the diagram above, the “normal” hearing levels are within the response area above 25 dB HL on the y-axis.
This means that your hearing system will be able to identify speech sounds, and other important sounds in everyday life.
Where Do Speech Sounds Fall on an Audiogram?
A speech banana is a banana-shaped range on an audiogram that covers the frequencies and loudness levels needed to understand speech. Inside the speech banana shows the usual level and frequency at which we hear both speech and environmental sound.

So, when the audiogram points are below these predefined points of various speech and surrounding sounds, people will tend to miss out on this information.
As the severity level of hearing loss increases, your ability to understand speech and other environmental sounds becomes poorer.
As you can see from the diagram, someone with moderate hearing loss (41-55 dB) may only be able to hear very little speech when someone is talking at a normal level. People with severe hearing loss won’t be able to hear any speech when someone is talking at a normal level and will only be able to hear some loud sounds, which are at the bottom of the speech banana.
Where Do Everyday Sounds Fall on an Audiogram?
Our environment consists of sounds of different frequencies at various loudness levels. On the speech banana diagram, you can see where common sounds fall, such as a violin or a baby crying.
The diagram also tells us about the safety of the sounds in our environment. For example, the sounds produced by an aeroplane measure around 100 dB. Any sound above 85 dB has the potential to cause hearing damage, particularly with frequent or prolonged exposure. To protect yourself against noise-induced hearing loss, be sure to wear hearing protection and limit exposure to loud sounds.
The Next Step
By comparing your audiogram with the predefined normal levels of sensitivity, your audiologist can determine whether you have hearing loss and its severity. By understanding this extensively, the hearing healthcare professional will decide the next step based on your condition.
After noting down your minimum sensitivity level in each frequency, the audiologist will identify and quantify your hearing loss, the type of hearing loss, and the pattern of your hearing loss. This will help them determine whether you may benefit from treatment, such as hearing aids.

The Value of Those Tiny Crosses and Circles
Knowing the real importance of these tiny crosses and circles in the audiogram can greatly impact your quality of life. Even mild hearing loss can take up much information from your world of sound.
Taking care of your hearing is extremely important. It’s always better to prevent hearing loss than to treat it.
Be sure to have an annual hearing check-up with your audiologist or hearing healthcare provider. And, always, feel free to discuss your hearing graph “the audiogram” with your audiologist. For improved hearing health for yourselves and your loved ones, ensure you understand your hearing test results.
Take your first steps today for a better hearing tomorrow!
